
News, views and tips on litigation graphics, trial strategy and the law.

How to Help Jurors Understand Spatial Relationships

Screen Shot 2023-10-16 at 11.28.48 AMGood visual presentations enhance juror attention, cognition and retention in the courtroom. By providing comparisons and reference points familiar to the juror, demonstratives can help communicate difficult concepts and data. Understanding of spatial information (e.g., positions, sizes and movement) particularly benefits from graphical representation.

In today’s blog post, we’ll explore a diagram from NASA’s Apollo 11 Lunar Landing program and then discuss takeaway lessons for litigators planning trial graphics. [Read more...]
An Infographic Lesson for Litigators

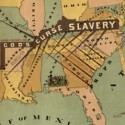
God's Curse SlaveryWe recommend to our readers a recent New Yorker article by Gareth Cook entitled Why Abraham Lincoln Loved Infographics. Cook’s New Yorker article discusses Lincoln’s “slave map” as an early example of an infographic.

Infographics—such as maps and charts that visualize data—are a powerful communication tool for litigators. As Cook explains, infographics take “information that is not easy for us to absorb … and put it into a form … that the brain can interpret with speed.”


[Read more...]

Why Animating an Internet Patent Can Help Your Case

play buttonGood animations can make difficult patent language and complicated patent diagrams come to life. An animation can make a bored judge or juror wake up, pay attention and engage with your argument.

For example, in defending a patent case, animating the simple and limited scope of what is actually described in the patents can be very important. Thus, an animation of the limited scope of what the inventor describes can be used to support arguments that the inventor did not invent anything worthy of a patent. Similarly, the animation can highlight the difference between what the patent describes and the accused infringing product.

Below is a sample animation developed by Cogent Legal similar to one that was recently presented in a summary judgment hearing. [Read more...]

How Graphics Helped a Trial Team Show Complex Data and Win

Screen Shot 2024-04-11 at 11.55.29 AMI love hearing the news that one of our clients had a great result using the work we did for them. The most recent big win I’m happy to report is Manatt, Phelps & Phillips, LLP, won a major lender liability/wrongful foreclosure action, obtaining a complete defense verdict in favor of its clients. Cogent Legal was hired to assist the Manatt trial team by creating graphics that helped bring order and understanding to this complex case.

The case involved Rincon Towers in San Francisco, which coincidentally is where I used to work; that’s where The Arns Law Firm set up shop when Bob Arns and I opened the firm in 1997. In 2007 Rincon Towers was purchased by the plaintiff in the case, who ultimately lost the property in foreclosure and sued multiple parties, seeking the property back and $40 million in damages. The case was a complex one involving many layers of parties, accountings on the properties and events over time. (For details on the case and the defense victory, read Manatt’s press release here).

Any complex transactional case such as this, which involves a great deal of accounting, lends itself to Excel spreadsheets that, by themselves, are not very helpful and make one’s eyes glaze over. We needed to help the trial team show a chronology of events and economic data based on the facts of the case and the experts’ opinions, so that the team could make their case to the judge as understandable and persuasive as possible. This was a bench trial, not a jury trial, which lends itself to more sophisticated or complex graphics, which are handed off to the judge and clerks so they can refer to them later as they’re writing the opinion.

Below are a few “sanitized” samples in which we changed the names of the witnesses and case information for the purpose of this blog post, but the samples illustrate the nature of the work Cogent Legal did on the case. [Read more...]

The Litigation Graphics Lesson in the “Wealth Inequality in America” Video

100 dollar billsI always like to share examples of what I consider powerful graphics to give attorneys ideas on what’s possible to create for use in litigation. This morning, I was struck by a video going viral that describes economic inequality in the United States.
Regardless of your politics, and whether you believe that the widening gulf between the poor and super-rich is a serious problem or mere propaganda of the Occupy Movement, I hope you’ll watch this video because it’s a fantastic example of how to show data in an effective and engaging way. In particular, if you’re an attorney who presents cases with large amounts of economic facts and figures, you’ll want to see how this video combines storytelling with clean, simple and powerful data visualization techniques.

One thing I appreciated immediately is the power of the narrator, enhanced by the pacing that he uses. His technique is similar to that of a good attorney giving a closing statement. [Read more...]

How Graphics Help the President Persuade and Can Help Attorneys Too

SOTU thumbnailLast week, Ken Broda-Bahm wrote a great piece about the recent State of the Union Address (“Check Your Alignment in Multiparty Litigation“), commenting on how the dueling responses by the Republican Party (Mark Rubio) and the Tea Party (Rand Paul) exposed the similar difficulties co-defendants in a trial face while trying to keep message control in front of a jury. Ken’s examination of the State of the Union Address through the lens of trial issues also reminded me of the post last year by Ken Lopez on the use of graphics in the State of the Union Address (“Presentation Graphics: Why the President is Better than You“), which related a number of great tips and showed why attorneys should look at the White House use of graphics in presentation, since they are certainly well done.

Better late than never, I figure it’s time for me to put in my two cents on the topic and show some examples from the State of the Union Address that might help attorneys improve their own use of charts and graphs in litigation. Visualizing and presenting data in an engaging, persuasive way is critically important for numbers-heavy cases involving financial transactions and economic data. I’ve seen attorneys present graphs and spreadsheets that are about as interesting as watching paint dry. The president’s team, by contrast, created graphs that hold the viewers’ attention and strengthen the points he makes orally.

The day after I watched the address live on TV, I looked at the online “enhanced” version at whitehouse.gov. I am obviously biased, but in particular I admire the president’s address because I really do love seeing graphics used effectively and well. It’s like being a football fan and watching a great football game when everything is done just right. One thing I like in particular is a point that Ken Lopez made very well: that every slide is “simple enough to understand in a moment or two.” All of the graphics are simple, yet carry a strong message. They are not intended to be objective, but rather to be like a closing statement when graphics are used to sway the viewer to your point of view.

Let’s look at a couple of ways these graphics use effective techniques to push their point of view fairly but persuasively. [Read more...]

Lessons from ABOTA Masters in Trial: Cutting-Edge Techniques for 21st Century Evidentiary Issues

This post is by Martha Pettit
Design & Administration Associate

We are in the midst of a big data explosion. E-discovery, metadata, black box data, cell phone records, social media … the list goes on and on. Last Friday at the American Board of Trial Advocates (ABOTA) Masters in Trial in San Francisco, I learned how trial lawyers are navigating and harnessing this brave new world of big data (or as they refer to it, evidence) to their advantage with demonstrative aids and expert testimonies. As a bona fide data visualization geek and ex-debater, my day in a room full of lawyers talking data was quite a treat.

Some of the key takeaways from the ABOTA masters that can benefit all trial attorneys: [Read more...]