News, views and tips on litigation graphics, trial strategy and the law.

How Graphics Helped a Trial Team Show Complex Data and Win

Screen Shot 2024-04-11 at 11.55.29 AMI love hearing the news that one of our clients had a great result using the work we did for them. The most recent big win I’m happy to report is Manatt, Phelps & Phillips, LLP, won a major lender liability/wrongful foreclosure action, obtaining a complete defense verdict in favor of its clients. Cogent Legal was hired to assist the Manatt trial team by creating graphics that helped bring order and understanding to this complex case.

The case involved Rincon Towers in San Francisco, which coincidentally is where I used to work; that’s where The Arns Law Firm set up shop when Bob Arns and I opened the firm in 1997. In 2007 Rincon Towers was purchased by the plaintiff in the case, who ultimately lost the property in foreclosure and sued multiple parties, seeking the property back and $40 million in damages. The case was a complex one involving many layers of parties, accountings on the properties and events over time. (For details on the case and the defense victory, read Manatt’s press release here).

Any complex transactional case such as this, which involves a great deal of accounting, lends itself to Excel spreadsheets that, by themselves, are not very helpful and make one’s eyes glaze over. We needed to help the trial team show a chronology of events and economic data based on the facts of the case and the experts’ opinions, so that the team could make their case to the judge as understandable and persuasive as possible. This was a bench trial, not a jury trial, which lends itself to more sophisticated or complex graphics, which are handed off to the judge and clerks so they can refer to them later as they’re writing the opinion.

Below are a few “sanitized” samples in which we changed the names of the witnesses and case information for the purpose of this blog post, but the samples illustrate the nature of the work Cogent Legal did on the case. [Read more...]

A “Recovering Lawyer” on Creating Good Presentations and Being a Good Attorney

outsidetheboxIn my continuing effort to point out effective presentations that attorneys can learn lessons from for case presentations, I came across one that teaches on two different fronts. I saw a Slideshare presentation by Matt Homann, the founder of LexThink, which is a firm dedicated to helping attorneys collaborate and work better. Matt is a self-described “recovering attorney” who gives presentations for a living, and it shows.

His presentation, embedded below, covers “Ten Ways to Build a Better Firm.” Thanks to the images and selective use of text, it’s both inspirational and practical, conveying so much more than words alone could.

In the first place, I love the humor that comes across. However, the main take-away is the simple concept of lots of pictures and only a few words per slide. While graphics for trial obviously have to be a bit less humorous and more staid, the example of using full-frame photos with a partially transparent bar on the bottom for the titles is a good lesson to learn. If you cannot fit your thought on the slide in that small of a space, then you either need another slide, or need to figure out how to edit your concept down. The fact that this presentation has 77 slides means that he would be moving through slides at more than one per minute, which helps keep an audience’s attention.

Secondly, I like the message for attorneys on how to make their practices more innovative by networking, finding mentors and recognizing the inherent stresses of the legal life. I recommend checking it out.

Do you have a Slideshare presentation you’d recommend for attorneys? Please let me know through email or in a comment below because I’d like to spotlight more of them.

Getting a Brain Injury Animation Admitted the Hard Way

brain-injury-125x125The great thing about trials is you never know what’s going to happen. I certainly never heard of an attorney offering to place herself into potential physical harm in order to get an animation admitted into trial, but that’s exactly how Julie K. Parker got an animation done by this office into her recent trial Hoopfer v. Fry’s Electronics.
First, a little bit of background information on this case: Ms. Parker of La Mesa (San Diego County) and her co-counsel Cassandra Thorson represented Kevin Hoopfer who shoplifted a $35 item from a Fry’s Electronic Store in San Diego. When the security personal saw his shoplifting, one of them followed him out of the store, confronted him and manhandled him to the ground. [Read more...]

How Interactive Timelines Build and Strengthen Opening Statements

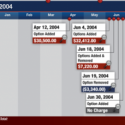
Screen Shot 2024-03-14 at 9.13.59 AMTimelines are probably one of the most common things we create at Cogent Legal for clients in all types of cases. Employment, business and personal injury cases are ideally suited for laying out the facts in chronological order to enhance jury understanding. When discussing the various options of timelines with clients, there are basically two main types to consider: Static and Interactive.
A static timeline can be done on a blow-up board and shown to the jury during any key moment of the case. The downside of a static timeline is that, unless it is really simple with only a few entries, you risk overwhelming the audience with so much information at once that it can be hard for them to understand.

For this reason, we generally recommend attorneys start with an interactive timeline that shows events one at a time so that the jury focuses on a single point as the attorney makes it. The interactive format also allows for document treatments so you can choose a button to reveal key documents that relate to the timeline entry. The following example is from a case (where all the names and dates were modified), and it shows the strong functionality possible with the interactive format. My clients realized that when we finished the timeline with all the dates, entries and documents, not only did they have an engaging, effective tool to present their case; they also had their entire opening statement finished! They could simply go through each entry with the jury in opening and discuss the issues. [Read more...]

A PowerPoint Sample for Business Trial Lawyers

PPt slide of attyThe Association of Business Trial Lawyers asked Cogent Legal to prepare the graphics for a presentation last night on mock trials. The panel consisted of some of the best jury consultants in the country exploring the factors that make successful and worthwhile mock trials. Beth Bonora, Karen Jo Koonan, Andy Sheldon and Ron Beaton all touched on some of the key issues that attorneys should keep in mind regarding the proper use of mock trials in developing your case.

The presentation had three parts, with the first part handled by Karen Jo discussing what type of focus group or mock trial you may need depending on what information you seek to obtain. Beth and Andy then followed up with a discussion on issues of confidentiality and how to keep any process as confidential as possible. Lastly, Ron and Andy shared insights on how you take the information you learned from the mock trial and apply it to the actual trial. Attorney Doug Young did a great job moderating.

This terrific panel discussion gave my firm a chance to do a fun slide-based presentation for the jury consultants, which is often not possible in the serious world of litigation. While this presentation (embedded below) was intended to be playful, it provides a good example of some of the techniques I blog about concerning do’s and don’ts for PowerPoint or Keynote presentations. [Read more...]

The Litigation Graphics Lesson in the “Wealth Inequality in America” Video

100 dollar billsI always like to share examples of what I consider powerful graphics to give attorneys ideas on what’s possible to create for use in litigation. This morning, I was struck by a video going viral that describes economic inequality in the United States.

Regardless of your politics, and whether you believe that the widening gulf between the poor and super-rich is a serious problem or mere propaganda of the Occupy Movement, I hope you’ll watch this video because it’s a fantastic example of how to show data in an effective and engaging way. In particular, if you’re an attorney who presents cases with large amounts of economic facts and figures, you’ll want to see how this video combines storytelling with clean, simple and powerful data visualization techniques.

One thing I appreciated immediately is the power of the narrator, enhanced by the pacing that he uses. His technique is similar to that of a good attorney giving a closing statement. [Read more...]

What Litigators Can Learn From Some of the Coolest Graphics in Construction

construction graphic thumbnailI am constantly amazed at how the world of litigation has changed so much in such a short period of time since I started practicing almost 20 years ago. OK, I accept that some of you don’t think 20 years is a short period of time, but it sure seems like it to me. As I have mentioned in this blog before, the ability to make powerful, high-quality trial graphics was extremely limited by the software available in the early 1990s. I was reminded of how far we’ve come in the area of visualization and modeling when I recently had dinner with Mike McTeer, who made a similar career shift as I did, but in a different field. Mike has a background in construction, and a few years ago, he decided to start a firm that specializes in 3D visualizations of construction.

His firm specializes in “Construction Visualization Integration and Building Information Modeling,” which basically means he visualizes and creates models of projects so builders more fully understand the process of the project, discover better ways to build it, and identify problems before they occur. When I saw his work, I was struck by what a great tool this is for the construction industry. This type of computer modeling was impossible only a few years ago, and Mike says that a number of larger clients now require it for any job before the work starts.

You might ask, what does this have to do with litigation? Well, just like Mike’s clients who never used this process before then realized they cannot do a project without it, attorneys who discover how a case can be visualized and strengthened with graphics at an early stage begin to view litigation graphics as a de facto requirement for case preparation and presentation. [Read more...]

How Graphics Help the President Persuade and Can Help Attorneys Too

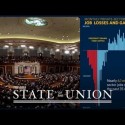
SOTU thumbnailLast week, Ken Broda-Bahm wrote a great piece about the recent State of the Union Address (“Check Your Alignment in Multiparty Litigation“), commenting on how the dueling responses by the Republican Party (Mark Rubio) and the Tea Party (Rand Paul) exposed the similar difficulties co-defendants in a trial face while trying to keep message control in front of a jury. Ken’s examination of the State of the Union Address through the lens of trial issues also reminded me of the post last year by Ken Lopez on the use of graphics in the State of the Union Address (“Presentation Graphics: Why the President is Better than You“), which related a number of great tips and showed why attorneys should look at the White House use of graphics in presentation, since they are certainly well done.

Better late than never, I figure it’s time for me to put in my two cents on the topic and show some examples from the State of the Union Address that might help attorneys improve their own use of charts and graphs in litigation. Visualizing and presenting data in an engaging, persuasive way is critically important for numbers-heavy cases involving financial transactions and economic data. I’ve seen attorneys present graphs and spreadsheets that are about as interesting as watching paint dry. The president’s team, by contrast, created graphs that hold the viewers’ attention and strengthen the points he makes orally.

The day after I watched the address live on TV, I looked at the online “enhanced” version at whitehouse.gov. I am obviously biased, but in particular I admire the president’s address because I really do love seeing graphics used effectively and well. It’s like being a football fan and watching a great football game when everything is done just right. One thing I like in particular is a point that Ken Lopez made very well: that every slide is “simple enough to understand in a moment or two.” All of the graphics are simple, yet carry a strong message. They are not intended to be objective, but rather to be like a closing statement when graphics are used to sway the viewer to your point of view.

Let’s look at a couple of ways these graphics use effective techniques to push their point of view fairly but persuasively. [Read more...]

A Graphics War Story: How a Big Board Showed Market Manipulation

silverbullion-125x125In this blog, we occasionally like to share stories of how legal graphics can change the course of litigation. The following war story comes courtesy of Roger Mead, an accomplished litigator at Folger Levin LLP in San Francisco.

The story involves civil litigation against the Hunt brothers in the 1980s claiming silver price manipulation. As the accompanying graphic illustrates, silver prices spiked in 1979 and 1980 and then collapsed. In 1979, the price for silver jumped from $6 per troy ounce ($0.193/g) to a record high of $48.70 per troy ounce ($1.566/g), an increase of 712%. The billionaire brothers Nelson Bunker Hunt and William Herbert Hunt were accused of causing the spike and collapse and conspiring to manipulate the silver market. After six months of testimony in a trial in federal district court in New York before Judge Lasker, a jury found for plaintiffs (see Hunts Are Ruled Part Of A Scheme To Control Silver, NY Times, Aug. 21, 1988).

For the trial, plaintiffs had created a graphic showing the rise and fall of silver prices, and they mounted it on a long board. Judge Lasker gave the plaintiffs permission to hang the board from the ceiling of the courtroom across from the jury box. The board hung there for the entire trial.

Using the data, we created a graphic to illustrate how a blow-up chart might be designed today for this case. Whereas in the early 1980s they may have spent a great deal of time creating a hand-drawn diagram, we used Adobe Illustrator to produce this easily: [Read more...]

How to Effectively Use Surveillance Video in Tort Cases

surveillance-cameras-125x125One of the things that has changed the most since I started practicing law two decades ago is the prevalence of surveillance video in tort cases. Twenty years ago, surveillance was still primarily captured on videotape and was expensive and difficult to use and store as evidence. It was unusual for our litigation team to obtain any surveillance video for cases, and on the rare occasion we did get it, it never showed anything useful because it tended to be shot from a single camera pointed at an unhelpful angle.

However, with the growth of digital recording equipment and affordable disk space on computers, surveillance video and its use in court has skyrocketed. Now, not only is it common to have surveillance video available for a lawsuit, it’s also very likely to have the incident shown from more than one view. Videos from taxis, buses, buildings and street intersections often all combine to give multiple views of an incident.

Given the prevalence of surveillance video and its influence on litigation, it’s important for both plaintiffs and defendants to understand its limitations and how it can lead to misunderstanding rather than illumination of the incident. There is no question that surveillance video can be absolutely key evidence used by both sides to try to prove their case. It cannot be ignored by either side, and what the jury believes the video shows can determine how they decide the case.

One potential problem with using surveillance video as evidence is the simple fact that it generally does not capture “normal” time views. [Read more...]